For studios · Insights
Analytics
A clear read on how your studio is doing — revenue, bookings, memberships, and your most popular classes.
Analytics gives you the big picture at a glance — how busy you are, how much you’re taking in, and what’s most popular. Open Insights → Analytics.
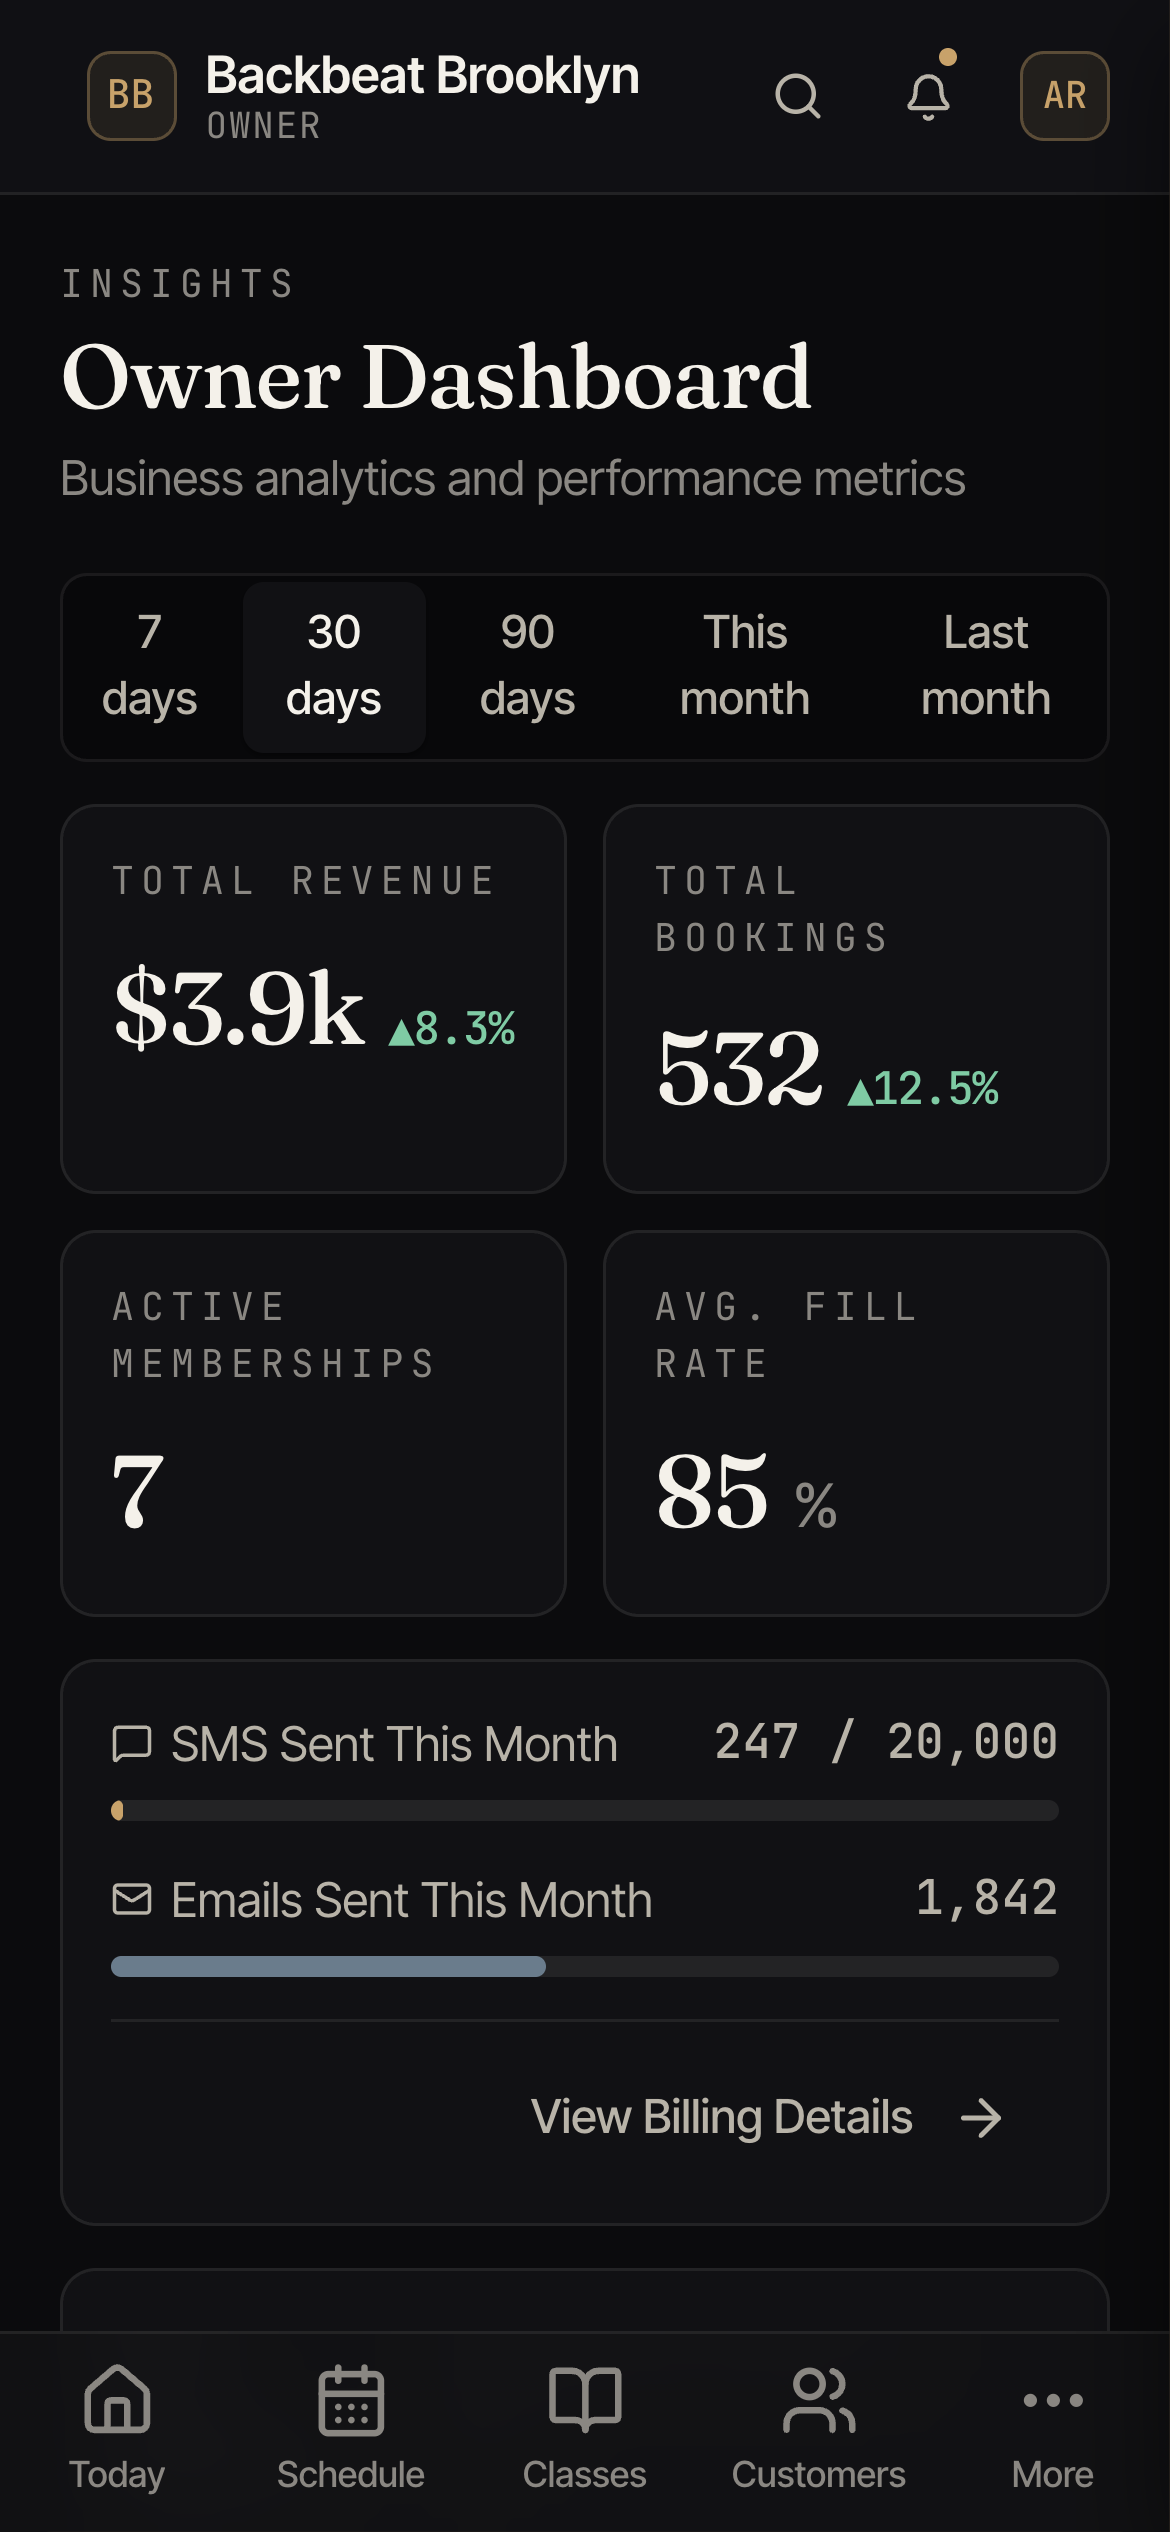
The headline numbers
The cards up top show your total revenue, total bookings, active memberships, and your average fill rate (how full your classes are on average). The little percentages compare against the period before, so you can tell a good stretch from a quiet one.
Choosing a period
Use the buttons at the top right — 7 days, 30 days, 90 days, This month, Last month — to change the window everything is measured over.
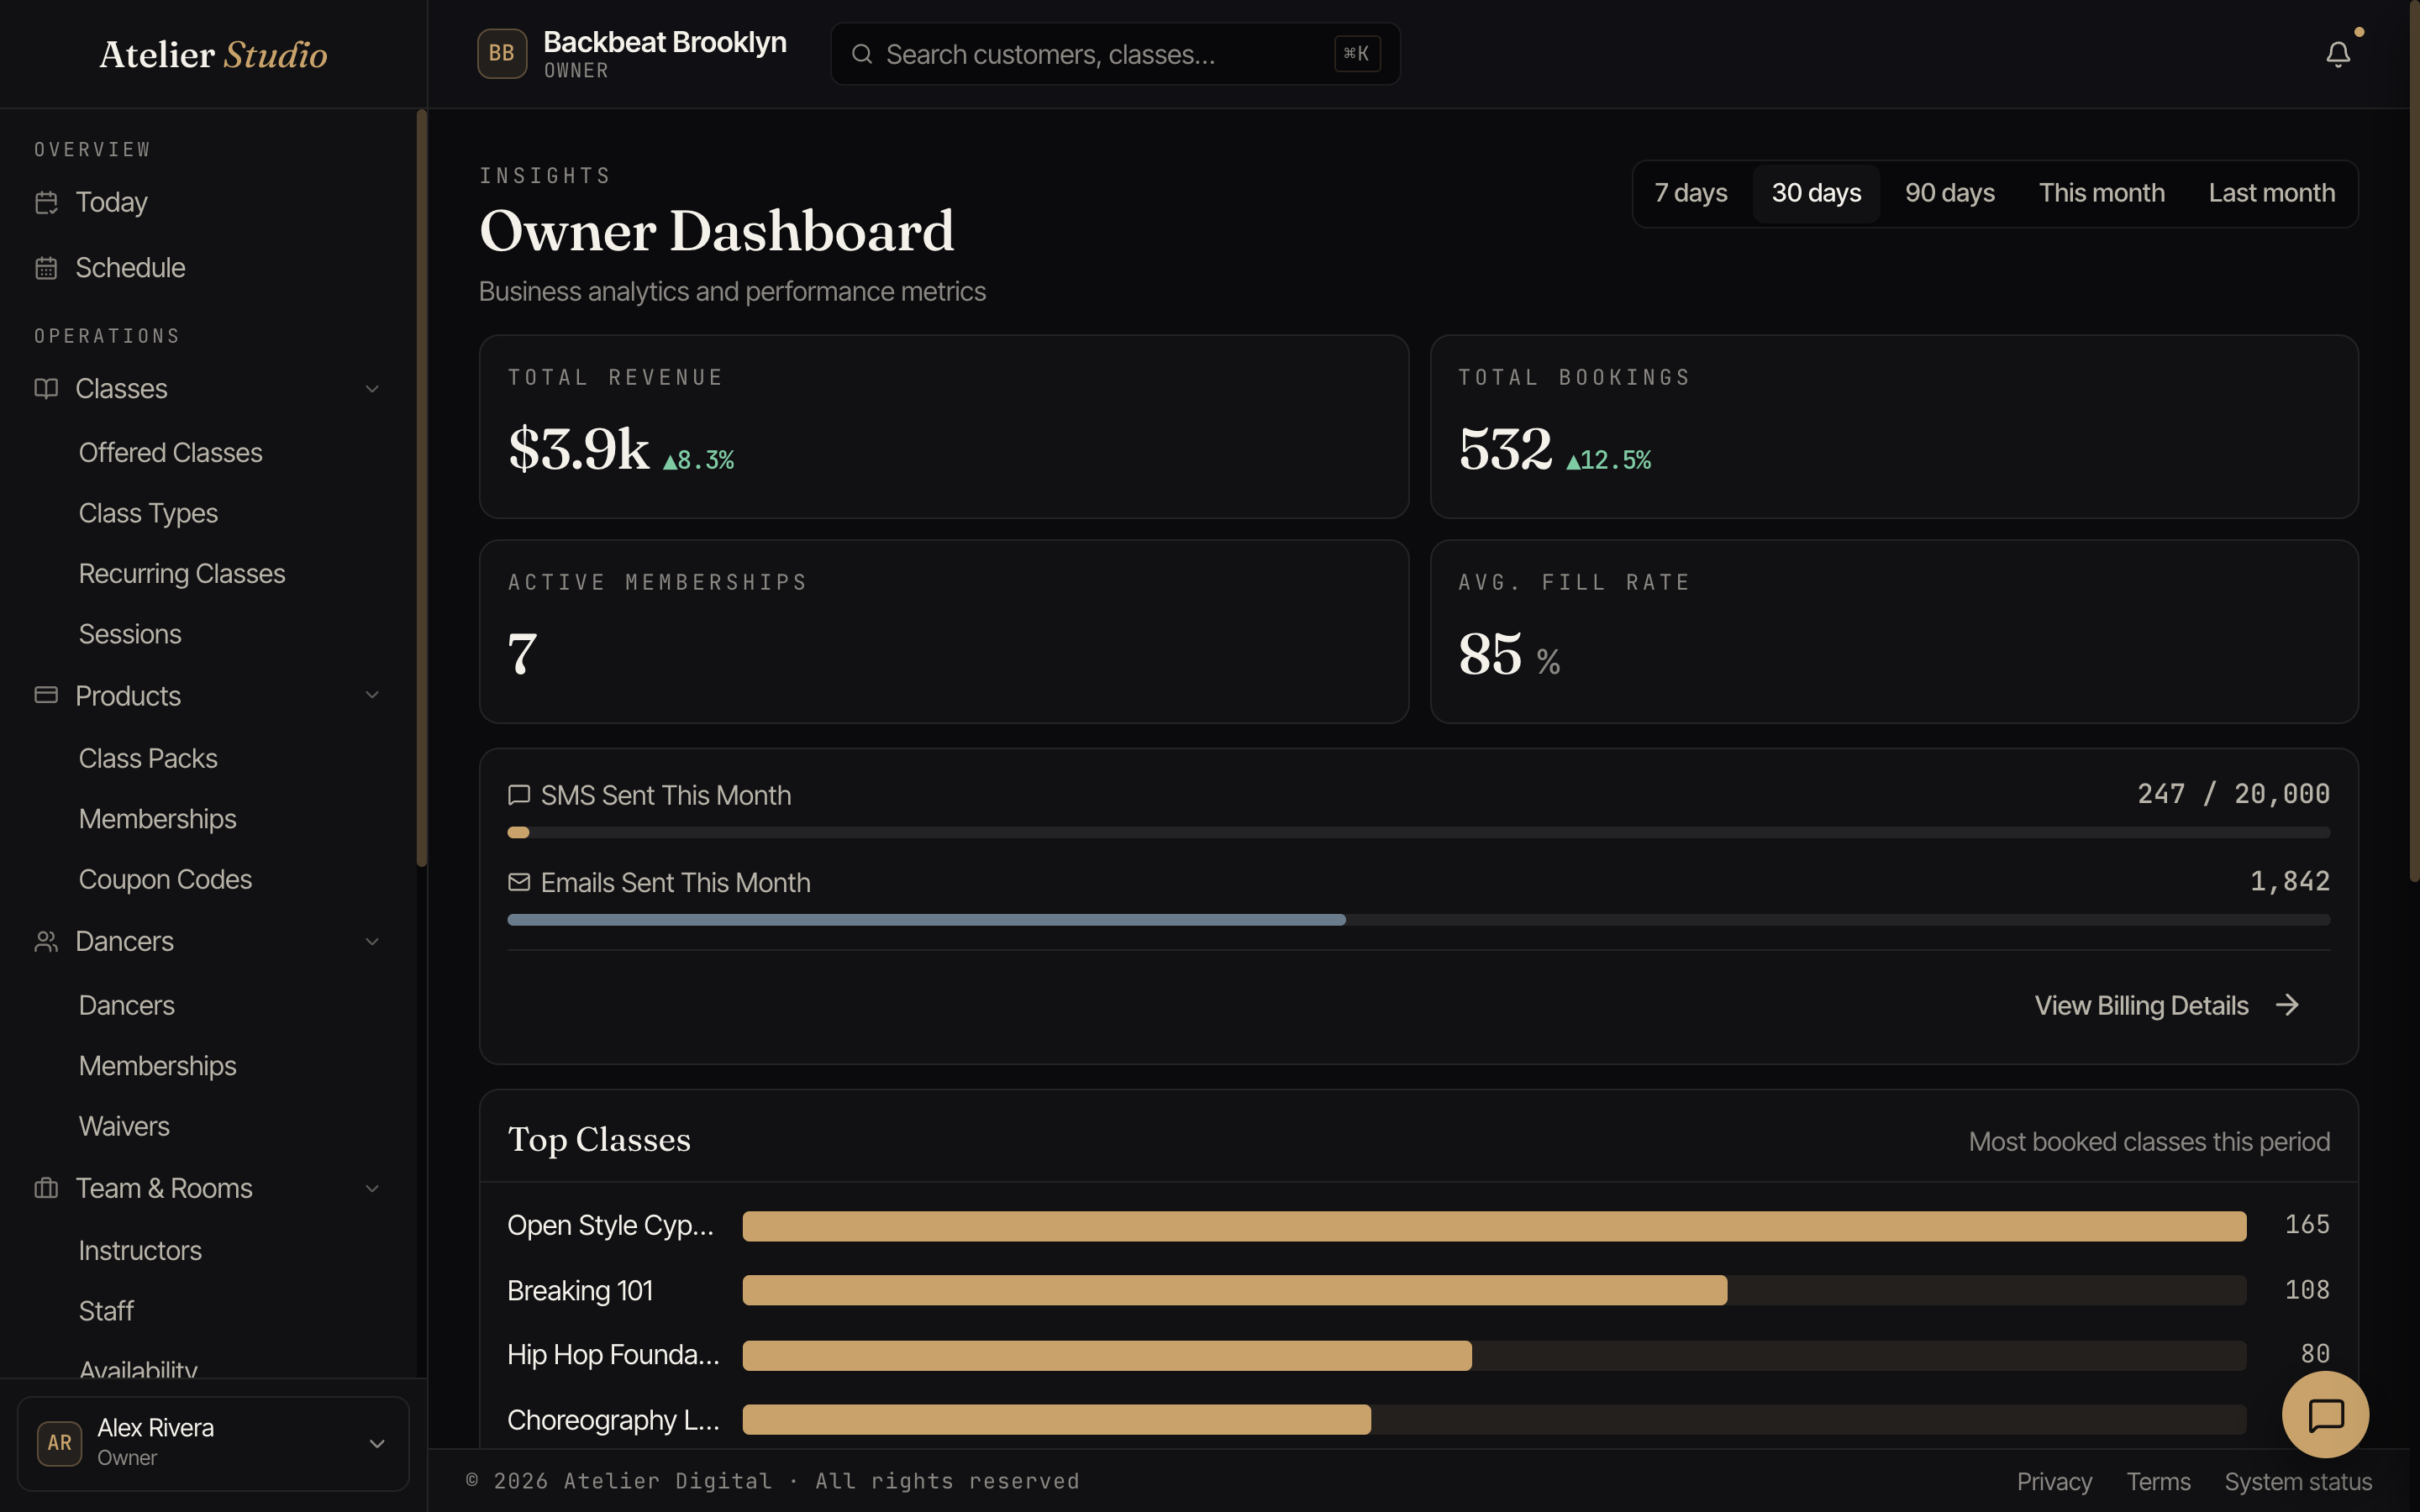
What’s popular
Further down, Top Classes ranks your most-booked classes for the period — handy for spotting what to put on more of. You’ll also see how many texts and emails you’ve sent this month.